Introduction Trade Nation has come a very long way in a short space of time. Previously known as Core Spreads, Trade...


A weekly friday email with best practices & resources to make winning decisions in your trading & investment journey!
Featured
Introduction Trade Nation has come a very long way in a short space of time. Previously known as Core Spreads, Trade...
Popular
Introduction Bearish Belt hold lines is a one day candlestick pattern. It is a single candlestick pattern that occurs during a uptrend and signifies a potential reversal or continuation of the bearish trend. What is Bearish Belt Hold Lines Candlestick pattern?...
Introduction: Falling Three Methods candlestick pattern is a five-day continuation patterns. This pattern provide insights into the market's psychology, and traders and investors often use them to add to or close positions. What is the Falling Three Methods...
Highly Recommended ..

The Shooting star is a one day potential trend reversal pattern. It usually occurs after an uptrend. Shooting...
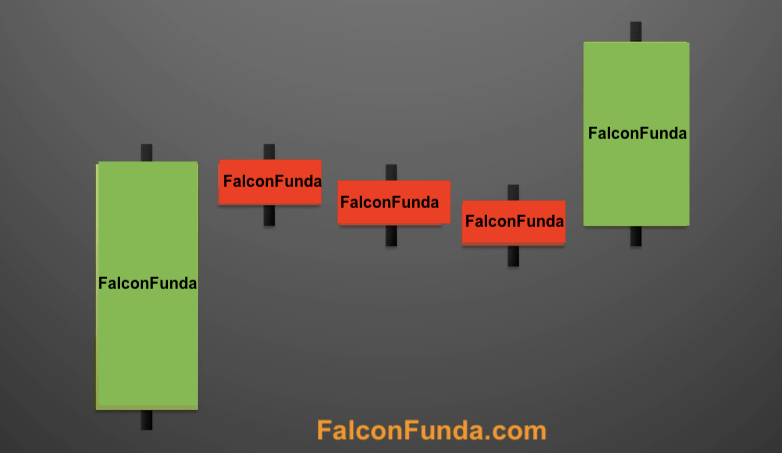
Introduction: Rising Three Methods candlestick pattern is five-day bullish continuation pattern. This pattern provide...

The Piercing pattern is a two day trend reversal pattern. A Piercing pattern happens after a...

The Inverted Hammer is a single day pattern. Inverted Hammer occurs when the price of the asset being traded ...
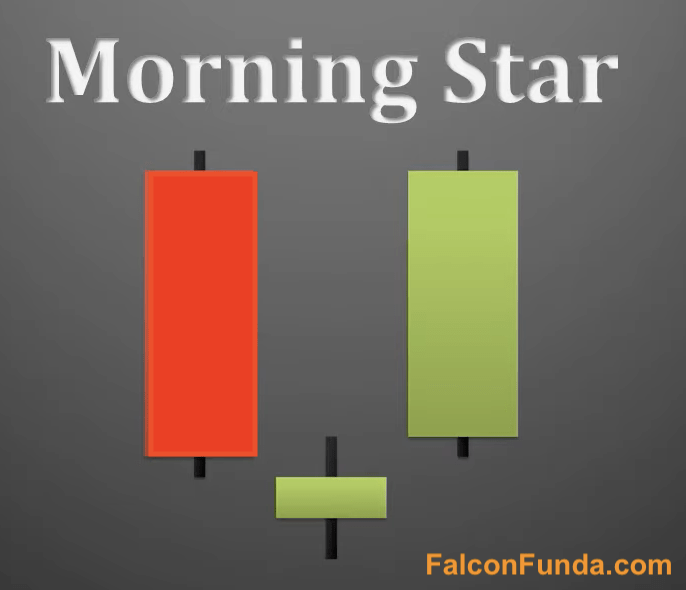
The Morning Star is a three day bottom reversal pattern. The Day 1 of the morning star pattern consists of a long...
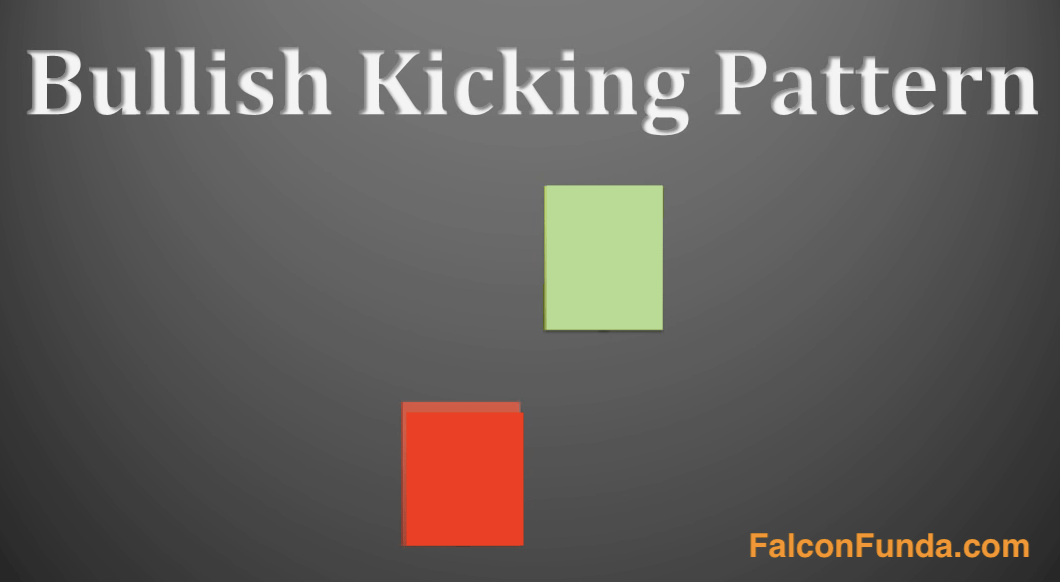
The Kicking Pattern is a two day reversal pattern. Day two candlestick starts an opposite trend to the previous...
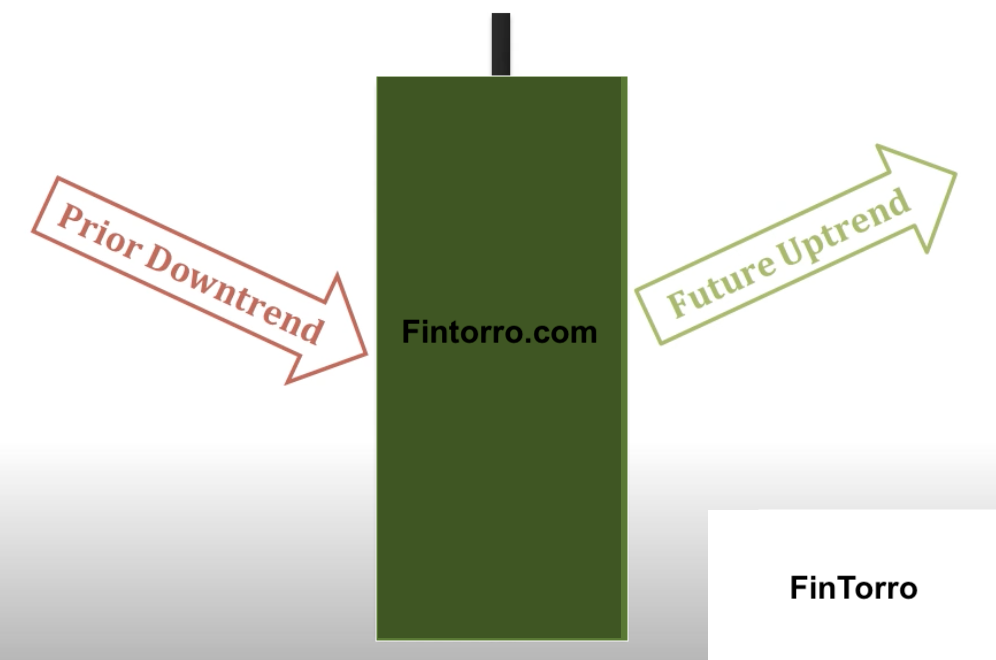
Introduction Bullish Belt hold lines is a one day candlestick pattern. It is a single candlestick pattern that occurs...

The Bullish Harami pattern is a two day pattern. It is made with one bullish candlesticks and a...

The Dark Cloud Cover is a two day pattern. It is made with one large bullish candlesticks and a large bearish...

Support and Resistance is a technical analysis concept / strategy used by traders to refer to the price levels on the...

Market Sentiment is the overall consensus about a particular security or market in general. This can be one of...

Transaction costs are incurred by a trader during buying and selling a security. These costs are on top of...

Volume is the total quantity of a particular security traded during trading hours on a given day or per transaction....

In Trading an order is a set of instructions to a broker to buy or sell an asset on a trader's behalf. An order can be...
When you place a trade, you are either buying or selling a security in the market. Buyers who are buying...
In trading, price is the most recent price at which a particular security was bought or sold.The price of the security...

Security is a tradable financial asset that holds some type of monetary value. Securities are broadly categorized...
A broker is an individual or a company who facilitates financial transaction execution on behalf of a trader....

Introduction Bullish Counterattack Lines is a two-day trend reversal pattern with one bullish candlestick and a...

The Doji is a single day pattern. It is a single candlestick where the open and close price is equal or very...
A weekly friday email with best practices & resources to make winning decisions in your trading & investment journey!