So, you want to be a stock market investor? It seems you think you’ve got what it takes. It's a wise decision to...


A weekly friday email with best practices & resources to make winning decisions in your trading & investment journey!
Featured
So, you want to be a stock market investor? It seems you think you’ve got what it takes. It's a wise decision to...
Popular
Learn from the Pros: Join FinTorro at the London Investor Show 2024 Introduction Fintorro is thrilled to announce our participation in the upcoming London Investor Show 2024 on November 1st, 2024, at the prestigious Novotel London West. This event, dedicated to...
Learn from the Pros: Join FinTorro's Table at the IX Trader Show' Working Lunch FinTorro is excited to announce that we will be hosting a table at the Traders' Working Lunch during the IX Trader Show 2024 on Friday, 27th September 2024. This special event offers a...
Highly Recommended ..

Aroon Indicator is a chart underlay indicator used by traders /investors to identify the trends and also their...
Follow the below steps to capture an image of your TradingView Chart. 1) Open your TradingView chart. 2) On the top...

As a beginner, are you debating how much money to allocate for trading? You can use FalconFunda's below 4D’’s approach...

Zero! You don’t need real money! Use the below approaches to start your trading journey before using real money. 1 Use...

Relative Strength Index (RSI )is a technical analysis momentum indicator used by traders /investors to identify extent...

By failing to prepare, you are preparing to fail.” - Benjamin Franklin Trading/Investing is a professional activity....

Moving Average Convergence Divergence (MACD) is a technical analysis momentum indicator used by traders...

Your attitudes and beliefs play an important role in your trading / investing journey. You can use FalconFunda's...

Exponential moving average (EMA ) is a technical analysis indicator used by traders /investors to identify upward or...

Exponential Moving Average is a very popular indicator for doing technical analysis! Follow these instructions...

Bar chart is a visual way to represent Open, High,Low, Closing pricing movements of the security. A single...

Emotions & Sentiments drive financial markets. So it is absolutely important for you as a traders/investor...

Chart pattern is a shape drawn on the price chart to predict future price movements based on the past data. ...
Traders use Trading Indicator as technical analysis tool on price charts to ascertain market conditions. There...

Stock market is a place where public companies list their shares for buyers and sellers to trade.Trading happens in...

Window is a two day potential trend continuation pattern. Window is a gap between two or multiple day...

The Upside-Gap & Downside-Gap Tasuki Pattern are three-day trend continuation pattern(s). The Upside-gap...

The Tweezer Pattern is a two day pattern indicating either a market high or market low. A Tweezer Top pattern...

The Upside Gap Two crows is a three candlestick trend reversal pattern. This pattern occurs after an...
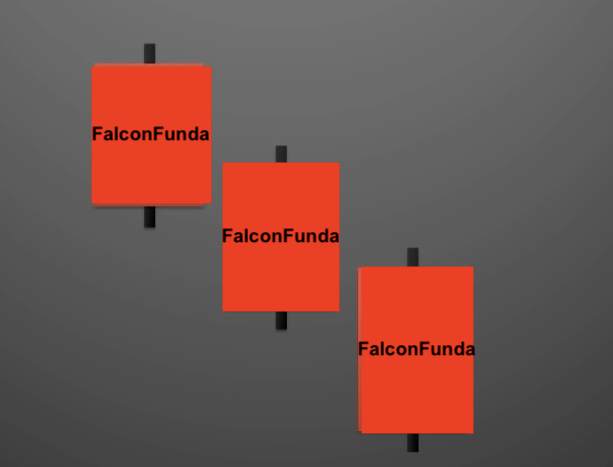
TheThree black crows is a three day trend reversal pattern. This happens after a uptrend and it has all...
A weekly friday email with best practices & resources to make winning decisions in your trading & investment journey!